This function normalizes each row of an input matrix by
subtracting each row by its mean and dividing it by its standard deviation
Arguments
- X
a numeric matrix of spectral data (optionally a data frame that can
be coerced to a numerical matrix). Optionally, a vector can be provided,
in which case it will be treated as a single spectrum.
Value
a matrix of normalized spectral data.
Details
SNV is simple way for normalizing spectral data that intends to correct for
light scatter.
It operates row-wise:
\[SNV_i = \frac{x_i - \bar{x}_i}{s_i}\]
where \(x_i\) is the signal of the \(i\)th observation,
\(\bar{x}_i\) is its mean and \(s_i\) its standard
deviation.
References
Barnes RJ, Dhanoa MS, Lister SJ. 1989. Standard normal variate
transformation and de-trending of near-infrared diffuse reflectance spectra.
Applied spectroscopy, 43(5): 772-777.
Author
Antoine Stevens and Leonardo Ramirez-Lopez
Examples
data(NIRsoil)
NIRsoil$spc_snv <- standardNormalVariate(X = NIRsoil$spc)
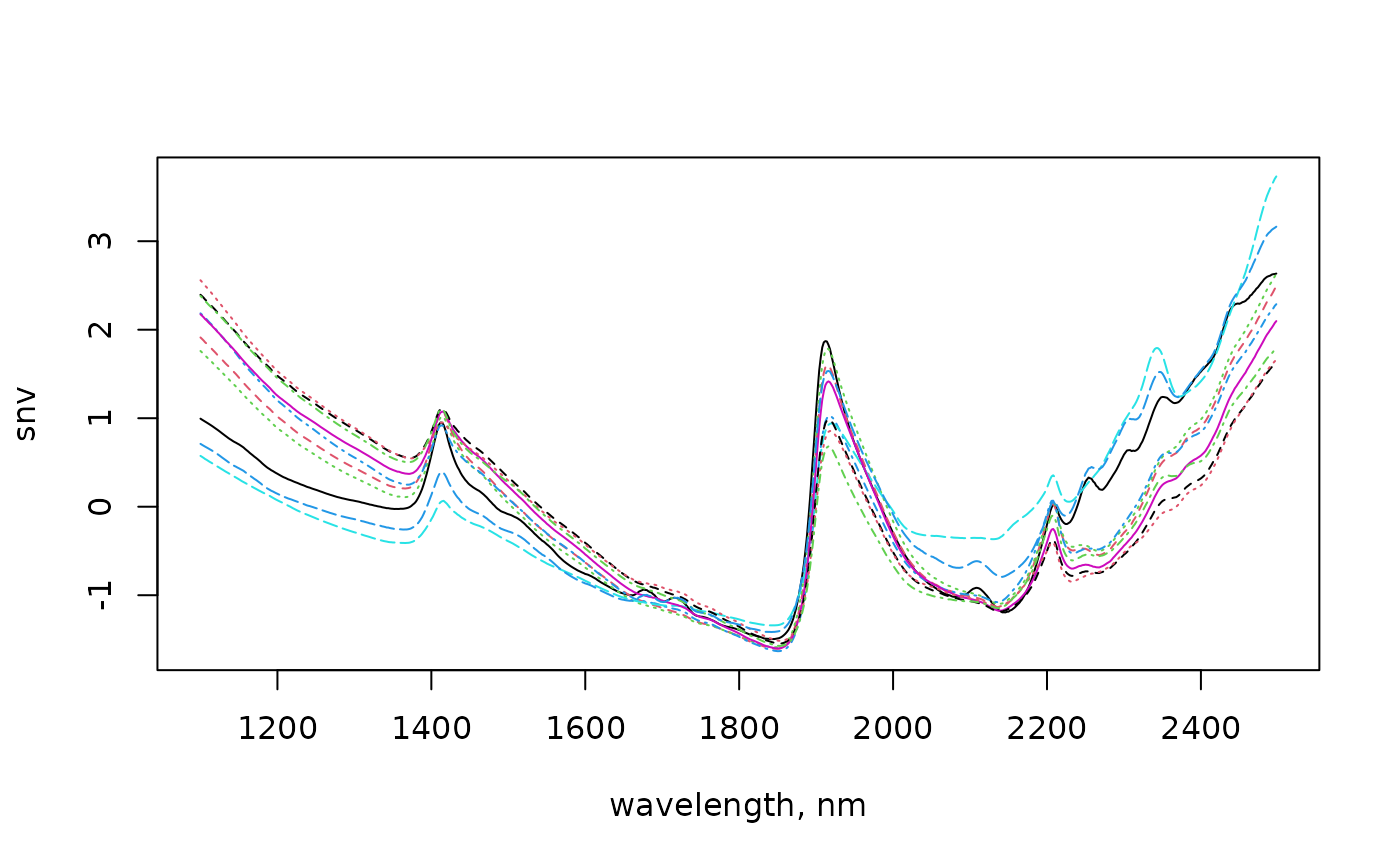
# 10 first snv spectra
matplot(
x = as.numeric(colnames(NIRsoil$spc_snv)),
y = t(NIRsoil$spc_snv[1:10, ]),
type = "l",
xlab = "wavelength, nm",
ylab = "snv"
)
 if (FALSE) { # \dontrun{
apply(NIRsoil$spc_snv, 1, sd) # check
} # }
if (FALSE) { # \dontrun{
apply(NIRsoil$spc_snv, 1, sd) # check
} # }