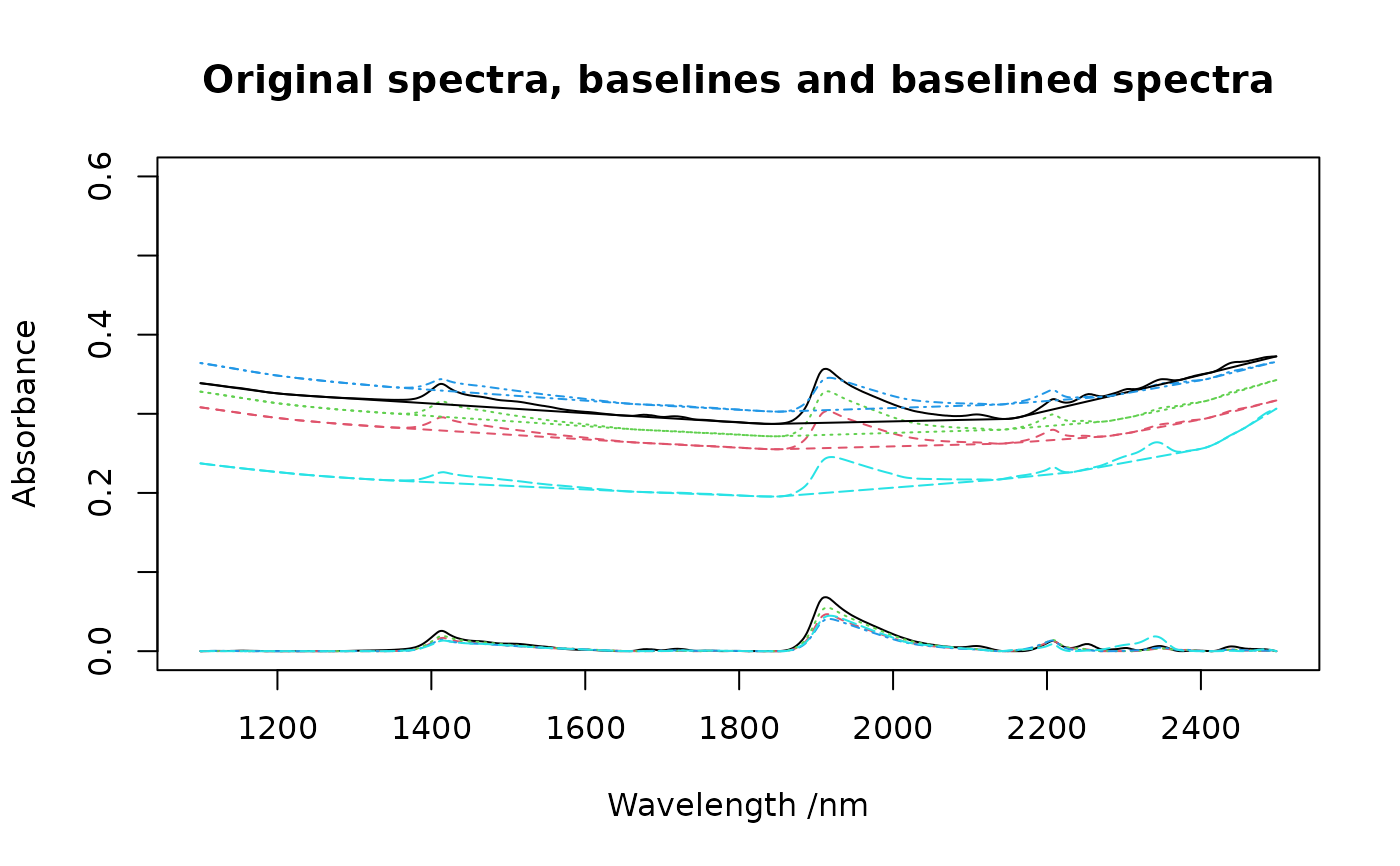

Fits a baseline to each spectrum in a matrix and removes it from the corresponding input spectrum. A vector can also be passed to this function.
Value
a matrix or vector with the baselined spectra. The resulting matrix
is output with an attribute called baselines which contain the spectra
of the fitted baselines.
This function is similar to continuumRemoval and it might
replace some of its functionality in the future.
Details
The baseline function find points lying on the convex hull of a spectrum, connects the points by linear interpolation and subtracts the interpolated line (baseline) from the corresponding spectrum.
Author
Leonardo Ramirez-Lopez with contributions from Mervin Manalili
Examples
data(NIRsoil)
wav <- as.numeric(colnames(NIRsoil$spc))
# plot of the 5 first absorbance spectra
matplot(wav,
  t(NIRsoil$spc[1:5, ]),
  type = "l",
  ylim = c(0, .6),
  xlab = "Wavelength /nm",
  ylab = "Absorbance"
)

bs <- baseline(NIRsoil$spc, wav)
matlines(wav, t(bs[1:5, ]))

fitted_baselines <- attr(bs, "baselines")
matlines(wav, t(fitted_baselines[1:5, ]))
title("Original spectra, baselines and baselined spectra")